SSIM vs Pixel Diff: A 40-Site Benchmark of Our Engine
The popular claim is that SSIM eliminates the false positives that plague pixel diffing. We build a visual testing engine that uses both, so we ran the test on ourselves: 40 real sites, three viewports, and our production comparison code. The honest result is that the claim is too simple. At default thresholds SSIM is actually the noisier method. Its real strengths are narrower and more interesting: catching structural changes, and holding up when you demand very few false positives. This is what the data shows, including the parts that do not flatter our own defaults.
Key takeaways
- On unchanged pages, SSIM at its 0.99 default flagged 20.8% as changed, versus 8.3% for our tuned pixel diff. The "SSIM removes false positives" claim does not hold at typical thresholds.
- At a matched false-positive rate the two methods are close. SSIM leads only at the tightest budgets; a pixel diff draws level and slightly ahead as you loosen up.
- SSIM's clear win is structural change: it caught 86.7% of shifted elements and 56.7% of hidden ones, against 50.0% and 23.3% for the pixel diff.
- SSIM's blind spot is colour. On a recolour, greyscale SSIM and the pixel diff tied at 40.0%, because SSIM compares luminance and structure, not hue.
- The median unchanged page was pixel-identical. False positives concentrate in a minority of dynamic pages, which points at masking, not the metric, as the real lever.
At a glance, at our shipped default thresholds:
| Metric | Tuned pixel diff | SSIM (0.99) |
|---|---|---|
| False positives, rendering noise (lower is better) | 8.3% | 20.8% |
| False positives, dynamic content (lower is better) | 20.8% | 31.7% |
| Detect element shift (higher is better) | 50.0% | 86.7% |
| Detect hidden element (higher is better) | 23.3% | 56.7% |
| Detect recolour (higher is better) | 40.0% | 40.0% |
How we ran the benchmark
We measured two things on every page: how often each method flags a page that did not change (a false positive), and how often it catches a page that did (a detection). The corpus was 40 public sites across marketing, docs, news, government, and content categories, captured at desktop, tablet, and mobile with Playwright driving headless Chromium. That is 120 comparison pairs per test arm, 360 in total.
The comparison itself runs our production code, not a re-implementation. The pixel diff is pixelmatch with the exact options we ship ({ threshold: 0.1, includeAA: false }), flagged when more than 1% of pixels differ. SSIM is our own implementation, flagged when the structural score drops below 0.99. Both defaults are the ones the product uses today. We also ran a "naive" pixel diff (includeAA: true) as a reference point for the classic raw comparison.
Each site produced three kinds of pair. A noise pair recaptures the same page about 1.5 seconds later with no change, so any flag is pure rendering noise. An interval pair recaptures about 12 seconds later, capturing genuine dynamic content. A mutation pair injects one known change before recapturing: an element shifted 7px, a recoloured control, a hidden element, or an enlarged heading. The mutation pairs are the only ones that contain a real change, so they measure detection. The full harness, including the site list, is in our repository so the run is reproducible.
Does SSIM really produce fewer false positives?
No. At the thresholds each method ships with, SSIM produced more false positives than the pixel diff, not fewer. On back-to-back recaptures where nothing changed, SSIM at 0.99 flagged 20.8% of pages as different. The tuned pixel diff flagged 8.3%, and even the naive pixel diff flagged only 11.7%. The headline claim runs the wrong way.
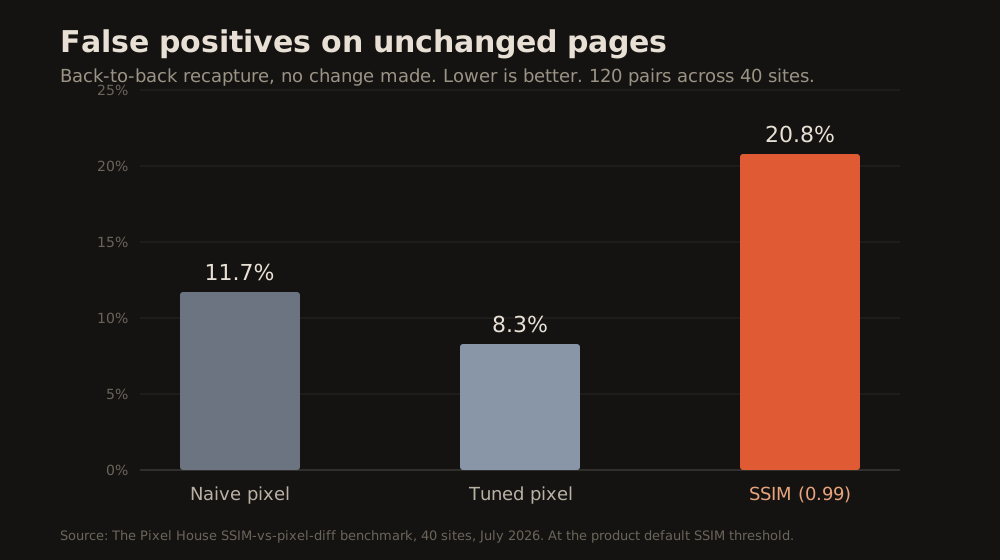
The reason is the threshold, not the theory. SSIM is genuinely good at ignoring rendering noise, but 0.99 is a strict bar, and small structural perturbations from sub-pixel layout push a lot of unchanged pages just under it. Our pixel diff, meanwhile, already excludes anti-aliased pixels and needs more than 1% of the page to differ before it fails. In other words, we compared a strict SSIM setting against an already noise-tolerant pixel setting. That is a fair test of what we actually ship, and it says our SSIM default is likely too strict.
One number reframes the whole thing. The median unchanged page had a pixel difference of 0.00% and an SSIM of exactly 1.0000. Most pages, most of the time, are identical between captures. False positives are not spread evenly; they come from a minority of dynamic, animated pages. That detail matters more than any single rate, and we return to it below.
The fair comparison: detection at a matched false-positive budget
Comparing two methods at their own default thresholds is not a fair fight, because the thresholds encode different risk appetites. The honest comparison holds the false-positive rate equal and asks which method catches more real changes at that rate. We tuned each method to the same false-positive budget, from a strict 5% up to a loose 25%, and measured detection.
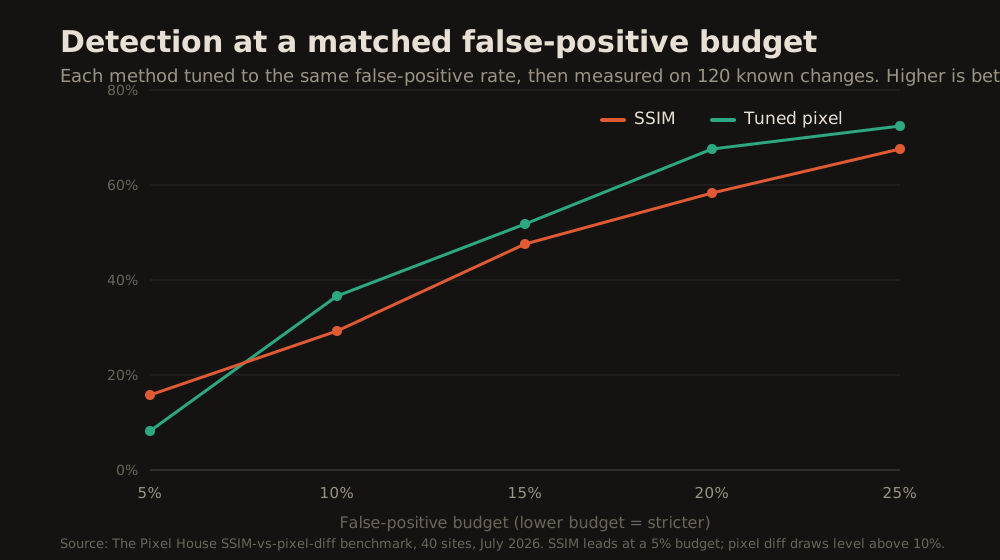
At the strictest budget, SSIM is clearly ahead: allowed a 5% false-positive rate, it caught 15.8% of real changes against the pixel diff's 8.3%, roughly double. This is the regime that matters most for a check you want to leave running, because a test people trust is one that rarely cries wolf. As the budget loosens, the advantage flips: at 10% and above, the tuned pixel diff matches SSIM and edges slightly ahead (72.5% versus 67.5% at a 25% budget). Neither method dominates across the board. It is a genuine trade-off, and the right pick depends on the false-positive rate you are willing to accept.
Where SSIM clearly wins, and where it is blind
SSIM's advantage is not general; it is specific to structural change. Broken into the four kinds of change we injected, SSIM caught 86.7% of shifted elements and 56.7% of hidden ones, against 50.0% and 23.3% for the pixel diff. When a layout moves, SSIM is the stronger detector by a wide margin, which fits its design: it scores local structure rather than counting pixels.
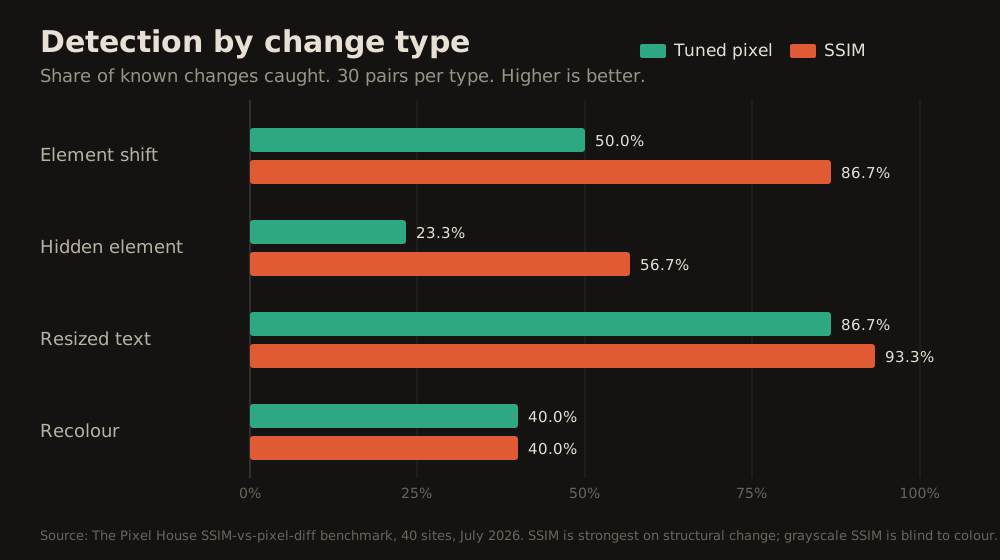
The blind spot is colour. On a recolour, SSIM and the pixel diff tied at exactly 40.0%. Our SSIM converts to greyscale before scoring, so a change in hue at similar luminance barely moves the score. A pixel diff sees colour directly, so this is a case where per-pixel comparison holds its own. If your regressions are often colour-only, brand palette swaps, state colours, theming, SSIM alone will miss some, and that is worth knowing before you rely on it. Resized text, a mixed structural and contrast change, was caught well by both (93.3% for SSIM, 86.7% for the pixel diff).
There is also a sobering point in these numbers for both methods. A 7px shift on a 1440px-wide page is a small fraction of the canvas, and both methods missed a meaningful share of the subtle changes. Whole-page comparison is a blunt instrument for small regressions, which is an argument for component-level and region-level testing, not just a better metric.
Why unchanged pages fail at all: dynamic content, not the metric
The largest source of false positives in our data was not rendering noise; it was genuine dynamic content. On the interval pairs, where we waited about 12 seconds and real page content moved, false positives rose sharply for every method. They reached 20.8% for the tuned pixel diff and 31.7% for SSIM, against 8.3% and 20.8% on the back-to-back pairs. Adverts rotated, tickers advanced, and carousels moved on. Those are real pixel changes, so flagging them is arguably correct behaviour, not a metric failure.
This is the practical lesson hiding under the metric debate. The way you cut false positives on real sites is by masking the regions that are meant to change, not by switching from one comparison algorithm to another. Both methods flag a rotating hero image, because both are right that it changed. Excluding it from the comparison is what makes the check quiet. We cover the techniques in how to eliminate false positives in visual testing; the benchmark simply confirms where the effort pays off.
What this means for your thresholds
The clearest action is to stop treating a default threshold as a setting you inherit and start treating it as a budget you choose. Our data says the common SSIM default of 0.99 is strict enough to be the noisiest setting we tested. A pixel diff tuned to the same false-positive rate is competitive with it. Neither is a reason to abandon SSIM; it is a reason to calibrate.
A workable approach is to decide the false-positive rate your team will tolerate on your own pages, then set whichever threshold hits it, and only then compare detection. If your regressions are mostly layout and structure, SSIM at a matched budget will serve you well. If they are often colour, keep a pixel comparison in the mix. And if your pages carry dynamic content, spend your effort on masking before you spend it on metric choice. We are revisiting our own SSIM default on the strength of these numbers.
Run it yourself
The benchmark is reproducible, and we would rather you checked it than took our word for it. The harness lives at benchmarks/ssim-pixel-diff in our repository. It captures the pairs with Playwright, runs the same pixelmatch and SSIM code described here, and writes a results.csv and results.json with every pair and the aggregated rates. The site list is editable, so you can point it at pages that look like yours.
The honest caveats. This is 120 pairs per arm across 40 sites, enough to be directional but not the last word; the confidence intervals are wide. The mutations are synthetic and modest in size, so absolute detection rates would shift with different changes. The SSIM figures are specific to our 8x8 windowed implementation at these thresholds, which is exactly the point, since it is what we ship. Another SSIM variant could land differently. We publish the method and the data so you can weigh all of that yourself. This piece also updates our earlier explainer, SSIM vs pixel diff: which catches real regressions?, which leaned harder on the "fewer false positives" framing than this data supports.
Further reading in this series
This study sits under our work on visual diffing and false positives:
- How visual diffing works: pixel, SSIM and perceptual comparison: the hub explaining each method from first principles.
- SSIM vs pixel diff: which catches real regressions?: the conceptual comparison this benchmark tests and corrects.
- How to eliminate false positives in visual testing: the masking and threshold techniques the data points to.
Sources
- The Pixel House, "SSIM vs pixel-diff benchmark" harness and dataset (
benchmarks/ssim-pixel-diff, 40 sites, July 2026): original data, method and raw results published for reproduction. - Wang, Bovik, Sheikh and Simoncelli, "Image Quality Assessment: From Error Visibility to Structural Similarity" (IEEE Transactions on Image Processing, 2004): https://www.cns.nyu.edu/~lcv/ssim/
- pixelmatch, the pixel-level image comparison library used for the pixel-diff arm: https://github.com/mapbox/pixelmatch
Frequently asked questions
Does SSIM produce fewer false positives than pixel diffing?
Not at typical default thresholds. In our benchmark of 40 sites, SSIM at its 0.99 default flagged 20.8% of unchanged pages versus 8.3% for a tuned pixel diff. SSIM's real advantage is structural change detection and very low false-positive budgets, not a blanket reduction in false alarms.
What is the false-positive rate of visual regression testing?
It depends heavily on the site and the threshold. In our data the median unchanged page was pixel-identical, so most pages produce no false positives. The rate is driven by a minority of dynamic pages: unchanged pages flagged ranged from 8% to 32% depending on the method.
Is SSIM better than pixel diffing for visual testing?
Neither dominates. At a matched false-positive rate the two are close. SSIM catches structural changes such as shifted or hidden elements far better, but greyscale SSIM is effectively blind to colour changes, where a pixel diff is competitive. The right choice depends on what you test.
Why do visual regression tests produce false positives?
Two reasons: rendering noise such as anti-aliasing and font smoothing, and genuine dynamic content such as adverts, carousels, and tickers. In our data dynamic content was the larger source. That is why masking dynamic regions matters more than the choice of comparison metric.
What SSIM threshold should I use for visual testing?
The common 0.99 default may be too strict. In our benchmark it was the noisiest setting we tested. Rather than accept a default, pick the false-positive rate your team will tolerate, then set the threshold that hits it. Calibrating to a budget beats copying a number.